To establish what is acceptable image quality, you can use a Structural Similarity Index to score the image quality of an original image versus a compressed image. An image CDN like ImageEngine by ScientiaMobile automatically optimizes file size while ensuring image quality that surpasses what is perceptible on each requesting device.
TL;DR Version
To establish what is acceptable image quality, you can use a Structural Similarity Index to score the image quality of an original image versus a compressed image. An image CDN like ImageEngine by ScientiaMobile automatically optimizes file size while ensuring image quality that surpasses what is perceptible on each requesting device.
Improving User Experience with an Image CDN
When you look at a picture on your computer screen, how do you determine quality? The perceived visual quality of a person looking at a picture is highly subjective and difficult to measure.
When we optimize an image through the image CDN ImageEngine, we look at many different variables, including visual quality. However, we extend the meaning of “quality” to include the user experience while browsing the web or using an app. A critical part of the user experience is delivering the image to the end user as quickly as possible, in the appropriate size and resolution, and in the best image format based on the end user’s browsing context.
ImageEngine goes out of its way to produce an image that delivers high visual quality with the lowest possible byte size. This way ImageEngine can improve the user experience by presenting great-looking images as quickly as possible.
However, there are trade-offs between file size and visual quality. Lower file size means lower visual quality simply because bytes are removed from image data. The question is, how much image data can you remove without significantly reducing the visual quality of the image?

Struggling to get your SEO just right? Start with your image optimization, and start with our blog!
WURFL Device Detection: the Key to Image Quality
Inside ImageEngine, balancing image quality with file size is a complex process that requires detailed input about the user’s device and browser. ImageEngine’s unique feature is its WURFL device detection. WURFL provides information about the screen size, file format support, and device pixel ratio for each device requesting an image. Thanks to WURFL device detection, we can feed extremely accurate inputs and settings into the image manipulation process. This means a better image across a wider range of browsing contexts than any other image CDN.
From time to time we are asked how ImageEngine can reduce the file size of an image by up to 80% without reducing its visual quality. Let’s see how we evaluate the visual quality of an optimized image:
Comparing the original image with an optimized image can be done by humans, but evaluating billions of images is too big of a task. Luckily, there are several tools which allow us to programmatically compare the visual difference between two (or more) images. The most commonly used metric is Structural Similarity Index Method (SSIM). SSIM gives a score based on how well the “pixel structure” of two images (i.e. two pictures but with different compression) match each other. The larger the difference in pixel structure between the two images, the greater the visual quality difference is.
What is Great Visual Quality?
As there are many variants of SSIM, we’ll be using DSSIM made by Kornel Lesinski in the following examples. DSSIM’s scoring scale starts at zero with a perfect score (which means the pixel structure is identical) and going up as high as 1 (where similarity is very low and image quality is poor). The DSSIM tool only gives a score, so it’s up to the user of the tools to set the threshold for what score qualifies as “good visual quality.” This is where the human eye and user testing comes in. To illustrate, let’s compare the original image with three progressively higher-quality compressed images and evaluate their DSSIM. In the following examples, we’re using ImageMagick and its quality parameter to drive image optimization.
Comparison One: Highest Compression, Quality = 1

Image by Ross Garner
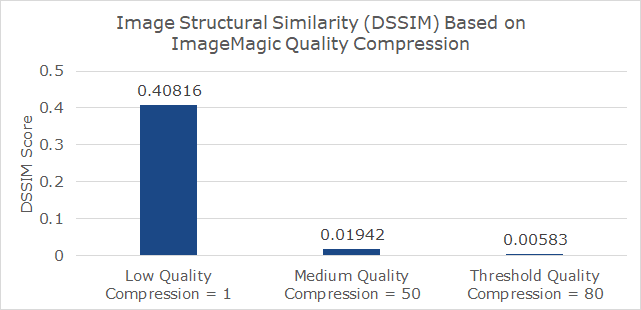
The original image is on the left. To the right, the same image is extremely compressed. The file size was reduced from 186KB to 8KB, but it’s obvious that the visual quality is low. The score from the DSSIM tool of 0.40816 reflects this unacceptable quality.
Comparison Two: Medium Compression, Quality = 50

At quality 50, it becomes difficult to spot any differences in our test image. But if we zoom in, we still see some pixelation and noise. The DSSIM score is now 0.01942, so we have to go lower than that.
Comparison Three: Threshold Compression, Quality = 80

At quality 80, the images are difficult (if not impossible) to distinguish at their intrinsic size. The file size is 86KB (a 54% reduction), and the DSSIM score is only 0.00583.
DSSIM and Perceptible Image Quality Analysis
Is a DSSIM score of 0.00583 good enough? 0.00583 is a sufficient threshold for this example image on most devices. However, this example does not set an absolute threshold for all images on all devices. ImageEngine uses inputs from WURFL device detection to drive its device-specific thresholds for quality and image compression. DSSIM thresholds for image quality are adapted based on the characteristics of the original image (e.g. high entropy) and the capabilities of the requesting device. For example, ImageEngine will deliver a higher quality image (with a lower DSSIM score) to a device with a larger screen with a high-density pixel ratio.
ImageEngine Settings and Visual Quality
ImageEngine has default settings that drive visual quality. To illustrate the image quality generated by these defaults settings, we evaluated 1,000 images randomly selected from our production environment. These images were very different: portraits, product images, nature, banner ads, and so on. We compared the original image with the optimized version produced by ImageEngine.
As is expected, the DSSIM scores in this study vary. By default, ImageEngine automatically calibrates its optimization based on the requesting device, so the resulting DSSIM scores will vary. The average DSSIM score for ImageEngine’s optimized images was 0.00488, and the median was 0.00427. This score is approximately 16% lower than the 0.00583 threshold established for visual image quality in our example above. In other words, ImageEngine has built in a “safety margin” to ensure the human eye can’t spot a significant difference between the original and optimized images. And it adapts the compression to what is perceptible on the requesting device.
Correlation of Image Optimization and DSSIM Score
As demonstrated above, file size clearly impacts image quality. It is vital to identify the optimal procedure to optimize an image. This is where ImageEngine excels. Below is a comparison of the optimization factor by ImageEngine and the DSSIM score.
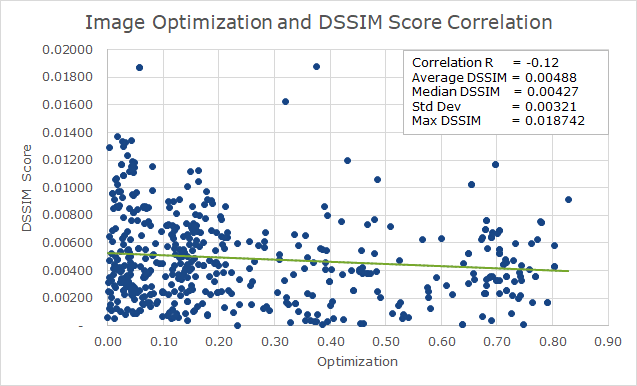
We might expect that higher optimization might lead to higher DSSIM (i.e. lower quality). If this were true, then we would see a correlation close to 1 ( i.e. a northeast diagonal trendline). Instead, we see a weak inverse correlation (an almost flat trendline that has a slightly negative slope of -0.12). This means the optimization factor automatically selected by ImageEngine does not negatively impact DSSIM and image quality. Therefore, it’s safe to say that there is no decay in visual quality when optimizing images with ImageEngine.
ImageEngine Keeps Image Quality
Based on the data set analyzed here, it is safe to say that the high optimization factor ImageEngine provides in its default settings does not impact the visual quality of the images delivered. Considering the improved load time of images, the overall quality of the user experience is greatly improved. There will always be outliers both in terms of images that for some reason have a lower visual quality than desired, and use cases that require images to have a higher visual quality. However, in such cases, the amount of compression and optimization done by ImageEngine can be adjusted to make sure the visual quality is still excellent. For most websites, whether it’s an eCommerce site, magazine, or corporate site, it is safe to let ImageEngine optimize images and improve performance.