The digital generation, or the digital natives, have grown up learning that electronic communication and the web is the environmentally friendly choice compared to paper and traditional means of information exchange. This might be true, but electronic communication also has an impact on the environment simply because it uses electricity. Now, we also know that emails, Instagram posts, and webpage requests generate a lot of data that is never deleted. Most likely, the data we generate online will live in datacenters around the world forever.
Therefore, as a developer or website owner, the most environmentally impactful action you can take is to reduce the amount of data storage and transfer required to display your website to your users. Start with images. Images account for around 60% of the bytes required to load the average webpage.
What is the Carbon Footprint of Images on the Web?
To answer this question we first need to answer two underlying questions.
- How much electricity (Kilowatt Hours – kWh) is required to transfer data (GigaByte)?
- What is the carbon footprint of one kWh?
Answering these questions precisely is very difficult and not an exact science because there are a vast amount of variables in motion.
Anyway, finding the exact numbers is not the purpose of this article. The purpose is rather to demonstrate that a website has a bigger carbon footprint than you’d think and that there are relatively easy actions that can be taken to eliminate tonnes (literally) of CO2 emissions generated by your website.
How Much Electricity is Required to Transfer a GigaByte of Data?
A widely quoted finding is from the research paper “The Megawatts behind Your Megabytes: Going from Data-Center to Desktop” by Costenaro and Duer (2012), of 5.12kWh per Gigabyte transferred. This is a very thorough analysis and includes the electricity required to transfer and store the data as well as the electricity required by the end user. However, the study is quite dated, and we know that the efficiency of mobile networks in particular has improved dramatically in the last decade.
“The Megawatts behind Your Megabytes: Going from Data-Center to Desktop”, David Costenaro and Anthony Duer, EnerNOC Utility Solutions, 2012
kWh required to transfer data on various networks:
Network Type | kWh required to transfer 1 GB of data |
Fixed | 0.08 |
2G | 37.00 |
3G | 2.90 |
4G | 0.58 |
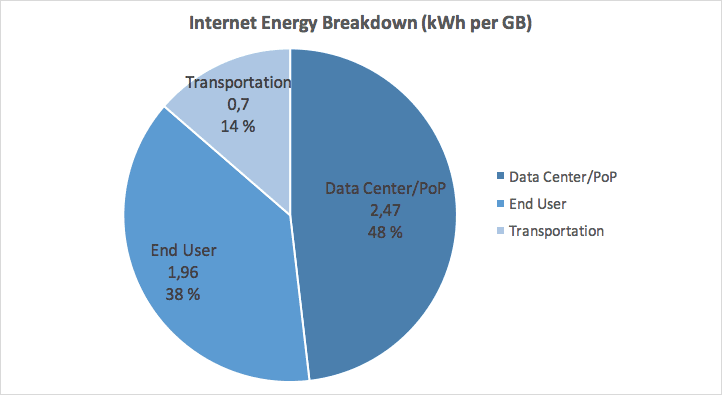
Note that electricity related to cloud storage and the end user is not included in these numbers. It is expected that the global consumption level is between 0.047–1.04 kWh per Gigabyte in 2020.
To arrive at a number we can use for our calculations further we’d have to estimate and make some qualified guesses. 5.12kWh is probably too high, because network efficiency has improved greatly since the study was published. In 2015 Ericsson estimated that each Gigabyte required 2 kWh to transport over a mobile network. Still excluding storage.
Estimating that mobile web browsing is 50%, there is a fair amount of 3G and even 2G users surfing the web. From the same study, the amount of data end users produce, in terms of social media posts, web surfing, and data generation, was estimated to be 7GB per month in 2019. On top of that, we know that the amount of electricity spent storing data on the internet has increased.
Estimates of the kWh-cost of 1 Gigabyte range from 1.8.kWh to 0.5 kWh. For simplicity, let’s estimate that 1 GB of data requires 1 kWh of electricity.

Look no further for your SMB SEO Guide - this is the only one you'll need.
What is the Carbon Footprint of 1 kWh?
Coming to the second part of our calculation, this is where it gets really confusing. It’s confusing because electricity can be produced by coal, wind, water, natural gas, nuclear and so on, which all have different carbon footprint. Furthermore, energy sources vary based on the type of plants in a certain geography. To further add complexity, the electricity market is a global market where countries can buy and sell electricity. So, it actually matters where the target market of your website is and where your users are.
Globally the average carbon footprint of 1 kWh is somewhere between 300 grams and 600 grams of CO2 per kWh. If you’re interested, you can see live details on energymap.org.
Again, for simplicity, let’s say that globally the average CO2 emission to produce 1 kWh is 500 grams. You can adjust the calculation to fit your case.
What is the Carbon Footprint of an Average Page View
Taking data from httparchive.org, we see that the sum of the byte size of all image requests made by a page has a median byte size of a little bit less than 1 MB.
If this webpage has 100,000 requests per month, our equation looks like this: 1MB x 100,000 pageviews x 12 months = 1,200GB of image data per year.
Using our estimates from above, the 1,200 GB of data require 1,200 kWh to be stored and transmitted. Producing the 1,200 kWh will emit 600 kg of CO2 equivalents over a 12 months periode. (1,200 kWh x 0.5kg CO2 = 600 kg).
On an average web page with 100,000 monthly pageviews, the images alone produce 600 kg of CO2 per year!
Reducing the Carbon Footprint of your Website with ImageEngine
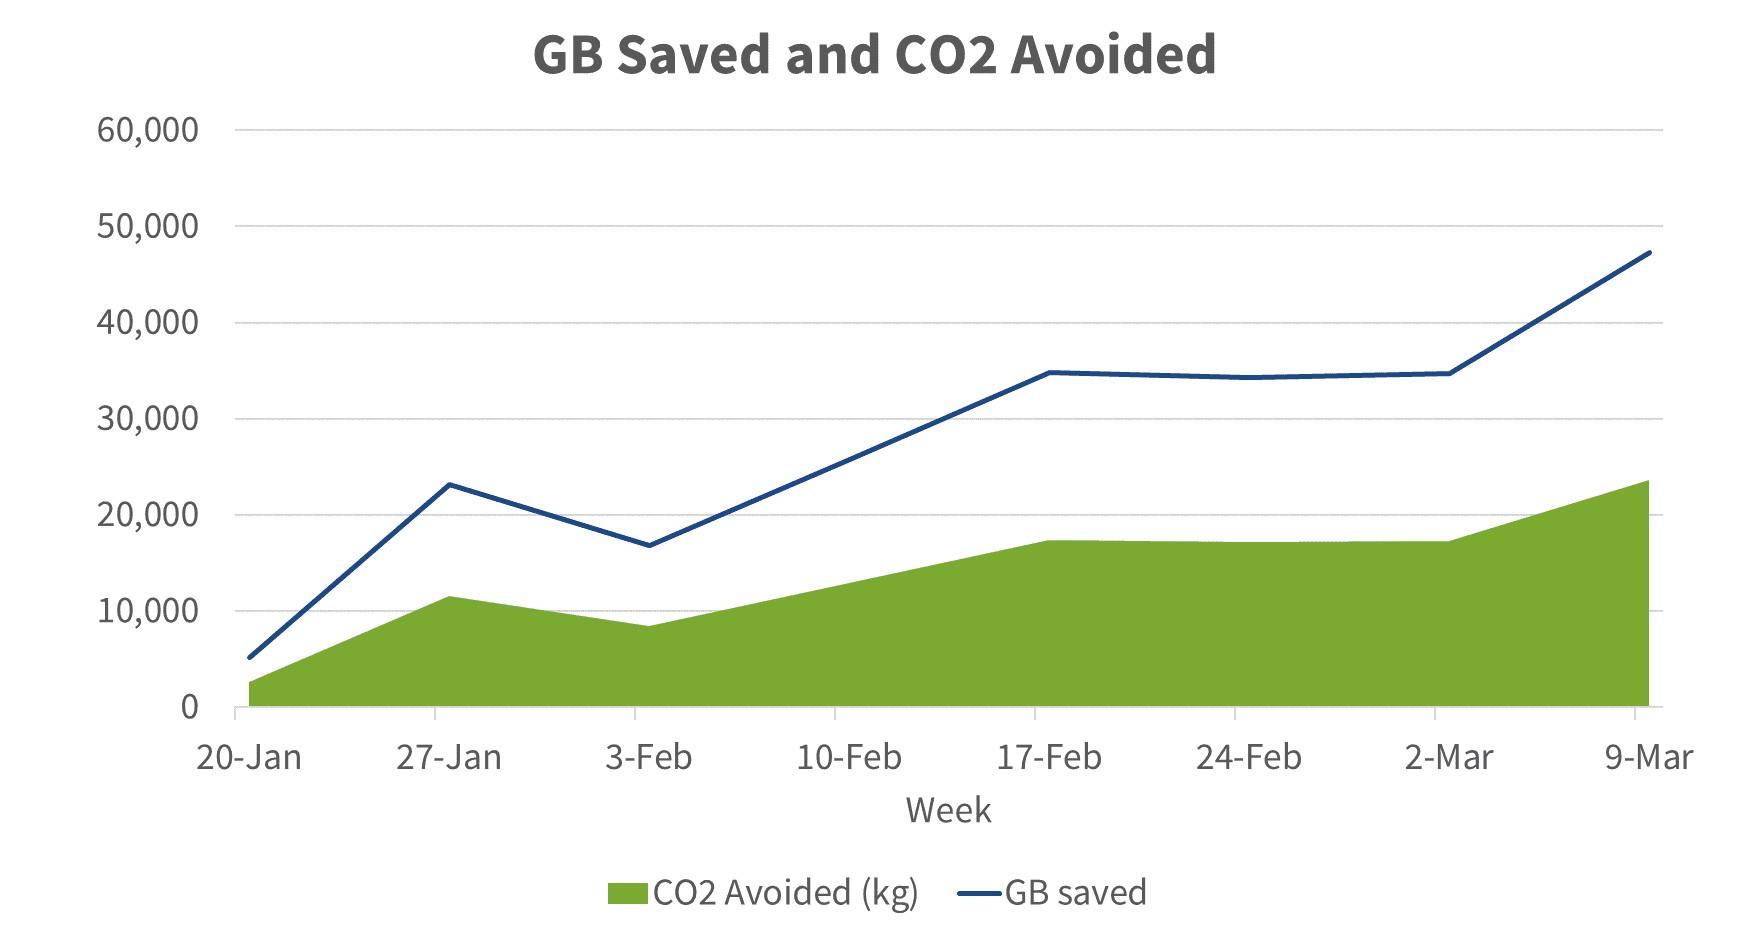
ImageEngine is an image CDN whose purpose is to reduce the image bytes transferred and stored, while at the same time maintaining the visual quality of the image. On average ImageEngine saves between 60 to 80 percent of the image byte size.
Only last week, ImageEngine saved the world of 17.5 metric tonnes of CO2 by optimizing images using the numbers above.
17.5 tonnes of CO2 is the same as
- 69,884 kilometers (43,424 Miles) [driven by an average car](https://www.epa.gov/energy/greenhouse-gas-equivalencies-calculator)
- Almost [10 roundtrips](https://co2.myclimate.org/en/portfolios?calculation_id=3430611) on a plane between New York and London.
- About the same amount of CO2 generated by two Europeans or one North American annually.
Closing Thoughts
It seems clear that optimizing images has a significantly positive impact on the carbon footprint of any website, even if the estimates presented here are rough, generalized, and based on different research with different system boundaries. Geography and end-user connectivity mix seem to be the most impactful variables. ImageEngine is the best-positioned image CDN thanks to its particular attention to mobile use cases.
If you are a web developer, addressing the obese images on the website you manage is probably the most impactful action you can take on a personal level if you want to reduce your carbon footprint.