How to Test Images Impact on Site Speed
Oversized images are a common cause of slow websites. Tools like Google Lighthouse and Webpagetest provide insights to why your site may be slow. An image CDN is the simplest, most effective, and most scalable way to solve the image problem. Our Image CDN, ImageEngine provides a webpage loading site speed test that provides CDN savings, payload reduction calculations, and other ways an image CDN can optimize images and accelerate your website.
What is an Image CDN?
You can find a complete description of what is an image CDN here. In a nutshell, an image CDN improves on a traditional CDN by using device detection and image optimization. Traditionally, a CDN works by pushing your content geographically closer to the user requesting your website. This accelerates delivery and relieves the burden on a single-origin website by using a global network of edge servers to cache (store) content.
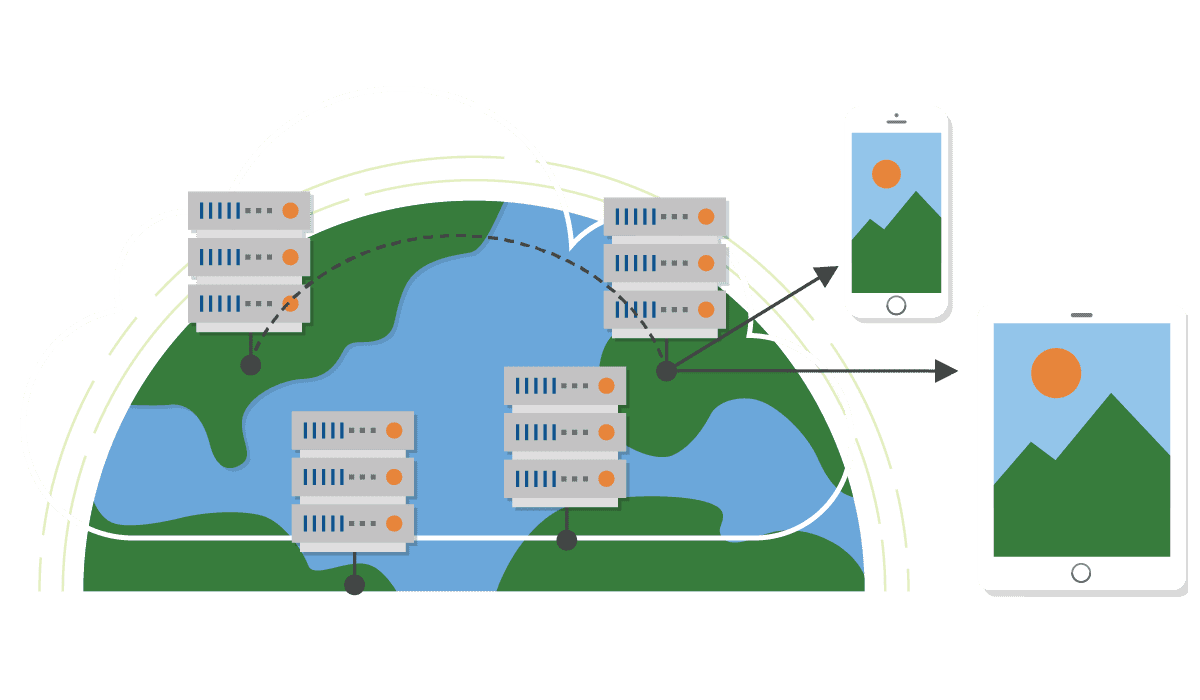
An image CDN takes it to the next level. By integrating device detection on every edge server, the image CDN can automatically determine key smartphone or tablet capabilities that impact images. These capabilities are passed onto the image CDN’s image optimizer, which takes the website’s original images and creates images tailored to specific device models. The optimized images are stored on edge servers for faster delivery of optimized images. Our image CDN, ImageEngine, can cut up to 80% of the image payload with no impact on visual quality and cut seconds off a website's loading time.
Does Your Site Need an Image CDN?
If your eCommerce site is global, relies heavily on mobile, or has thousands of images, you should consider an image CDN. Here’s why: You’re paying too much for bandwidth. An image CDN reduces the image payload and thereby, your bandwidth and CDN bill. On top of this basic cost savings for your CDN, image CDNs, scale globally in areas where internet speeds are slower. On top of this, if your site is heavy due to image-focused content, image CDNs will majorly improve site speeds.

Look no further for your SMB SEO Guide - this is the only one you'll need.
What Does ImageEngine Site Speed Test Analyze?
To start, you will need to provide a single webpage for analysis. This can be your home page, or an internal page. The test will pull in all the images and provide an estimate of before and after for a number of metrics, including:
- image payload reduction
- page load time
- speed index
- first contentful paint (TBD)
It will also generate a video that shows ImageEngine vs. the current site. Finally, it will go through each image and provide you a sense of the savings on each image, the final image format (e.g. WebP or JP2), and the visual quality of the image. In the background, this test actually uses the same analysis as Google Lighthouse, so you should have a sense of how Google will react to these improvements. Typically, Google boosts the search engine rankings of sites with faster loading times.
How Much Image Payload Savings Should I Expect?
On average, most ImageEngine customers see image payload savings of around 60%. This means if a website delivered 1,000 GB/month before using ImageEngine, then they would only deliver 400 GB/month of Smart Bytes (i.e. optimized image payload) using ImageEngine. Of course, savings will vary based on the initial image size and the types of devices requesting them. Savings typically vary from 40% up to 80%.
If the test does not provide results in the range mentioned above, then don’t give up. Contact us. It is typically due to problems encountered while analyzing your website caused by Javascript or blockages caused by your current CDN. A free trial is the best way to evaluate your website’s potential improvements.
ImageEngine offers several plans covering various image payload sizes and features. By making some assumptions based on the number of visitors or pageviews on your website, we can get a sense of the payload savings. Below is a table that outlines visitors, original image bandwidth, and final Smart Bytes. This table assumes:
- Payload/page = 1.9 MB
- Images/total page payload = 47%
- Image payload/page = 0.9 MB
- Pageviews per visit = 3
- ImageEngine Payload Reduction = 60%
Visitors/month | Original Image Payload (GB) | Smart Bytes (GB) | Plan |
5,000 | 14 | 5 | |
10,000 | 27 | 11 | |
20,000 | 54 | 22 | |
40,000 | 108 | 43 | |
80,000 | 216 | 86 | |
92,593 | 250 | 100 | Basic <100GB |
160,000 | 432 | 173 | |
231,481 | 625 | 250 | Standard <250GB |
320,000 | 864 | 346 | Pro >250GB |
640,000 | 1,728 | 691 |
Based on these assumptions, around 40,000 visitors per month is the top end for our Basic plan, and 100,000 visitors is the top end of the Standard plan. Above that, contact us for details on our Pro plan.
If you have statistics on your website from a tool like Google Analytics, we can help you calculate your estimated Smart Bytes. Feel free to contact us for guidance on this calculation and starting a free trial.